

The Layman’s Guide to Electricity: Part 2C
The Layman’s Guide to Electricity: Part 2C
Think not what the grid can generate for you, but what you can generate for the grid.

The Layman’s Guide series is a series of short articles going over particular aspects and principles of fields normally considered complicated or too academic for the average person. Emphasizing the principles and ideas that an average person may encounter in their daily life, while tying them together to the discipline as a whole, The Layman’s Guides are intended to be both a reference and an introduction. It is in essence what I wish I had when I was younger, a series of articles explaining key principles of a profession that allow one to begin exploring the field more holistically. This is the third part of the second part of the Layman’s Guide to Electricity – a shorter part talking about the contributions of different forms of power to the grid, helping us segue into the next part involving transmitting that electricity.
If you missed it, the first part of the whole guide and the first part of the second part are available below. If you want to know where on the electric bill we’re at, see the image below the link and above the divider. You will need the second link to fully understand this link, particularly the last section on dispatchable vs. non-dispatchable power and the discussion on base load, mid-range, and peaking power plants.
https://argomend.substack.com/p/the-laymans-guide-to-electricity-bde
https://argomend.substack.com/p/the-laymans-guide-to-electricity-4b2
If you want to support The Professional Amateur and get Layman’s Guides out faster, follow the Ko-Fi link in the button below. These Guides take a lot of time to research, write, and put together, so if you like them, please support them by liking and sharing them, or, if you really like them, feeding the dog at the button below.


The Requirements of the Grid
As we’ve covered in previous parts of the Guide, the grid needs to match the production of electricity with its consumption – doing both at the same time, and making sure there is enough capacity in case of sudden interruptions. In order to make sure this is the case, the grid has to measure generators in great detail, taking into account not only how much power it can generate (capacity), how reliably (reliability), how quickly (reactivity) and how cheaply (cost) they can do so. While incomplete, these measures give you an idea of what’s important to the grid, and why debates on energy policy can get so heated.
Nameplate Capacity
Nameplate capacity[1] is defined as the intended, full-load sustained output of a power station. Think of it as the best-case capacity metric. If you remember the generator nameplate example from Part 2A’s discussion on Volts, Amps, and Watts, individual generators each have nameplate capacities, which I post again here as an example.

I want to draw your attention to the 100 kVA/80 kW number – the latter half of the number you’ll see most often in the news. When the International Energy Agency reports renewable energy reaching 510 gigawatts (GW)[2], they refer to nameplate capacity. When Powermag reports a new 1.2 GW natural gas-fired plant in Texas[3], that also refers to nameplate capacity. When Recessary reports a new solar plant with battery backup in the Philippines, with approximately 3,500 MW of solar panels[4], is also nameplate capacity. Nameplate capacity is the most commonly-reported measure of capacity – often without the caveat that it refers to how much the plant is prepared to produce, not how much it actually produces. See the electricity bill below.

As we see here, you aren’t billed on kW/Kilowatts – but on Kilowatt-hours, or kWh. kWh is a pretty simple unit – run a 1 kilowatt generator at full power for one hour, and you’ve generated a kilowatt-hour. Take our 80 kW generator and run it at half capacity for an hour, and you’ve generated 40 kWh. The last of the articles above in particular, mentions that the TerraSolar project has 3,500 MW of solar capacity, and 4,000 MWh of battery storage. In theory, you could fully charge the batteries from 0-100% by diverting 100% of the solar panels’ to the batteries. In practice, there are two obstructions – first, that the solar panels aren’t dispatchable electricity, meaning that you can’t control when the electricity is generated, and second, that you can’t control whether or not the panels receive enough sunlight efficiently enough to put out 100% of their rated capacity. For a more reasonable estimate, we need to talk about dependable capacity.
Dependable Capacity
Dependable capacity[5] is the nameplate capacity of a power plant, adjusted downwards to account for adverse conditions for a specified period of time (usually a month or a year). Said adverse conditions can include maintenance downtime, reduced real-life efficiency compared to the drawing board, and derating due to aging, which reduces the efficiency and increases the maintenance of power plants over time. This estimate is most often used for medium to long-term planning – knowing how much capacity the grid can expect from an individual generator. For an actual measure of how well the generator does, however, we need to use the availability and capacity factors.
Availability Factor
Availability factor[6] is the ratio between the time in the period that the generator is available to produce electricity on the grid, divided by the total amount of time in the period. Also known as “uptime”, availability factor measures how often a generator is “ready” to step in and add its production to the grid. This can be reduced by factors like maintenance, fuel availability, or defects. As an example, a plant that is ready to generate (not necessarily actually generating) for 11 out of the 12 months of the year, has an availability factor of 11/12 – about 91%.
Periods where only partial capacity is available may be reduced from availability factor, leading to Equivalent Availability Factor (EAF). In our example, say that our plant is ready to generate for 11 out of the 12 months out of the year, but in November, one of its two 50 MW units was damaged and could only generate for 10 of the 12 months of the year. In this case, the first 50 MW unit has an Availability Factor of 11/12 (91.7%), while the second one has one of 10/12 (83.33%). Since both units are exactly half of its capacity, the plant has a whole has an equivalent availability factor of 10.5/12 (87.51%).
This definition works great for conventional thermal or fueled power plants, where production can be directly controlled and is subject generally to fuel and maintenance constraints. This leads to 70-80% availability factors, with gas turbines usually reaching 90-95%. When the fuel is collected, as in the case of wind and solar, the turbine and panel are generally available to produce, leading to availability factors of 98% for wind and near-100% for photovoltaic solar as long as the sun is shining. This is due to a quirk of the number - the convention is that periods when the plant is available but not actually generating are not counted as part of the availability factor, meaning that these generators are greatly advantaged. These flaws in the availability factor metric lead us to use capacity factor, instead.
Capacity Factor
Capacity factor[7] is the ratio between actual electrical energy output over theoretical electrical energy output for a certain period. Most often expressed as a percentage, capacity factor tells you how much of the generator’s theoretical capacity is actually being used. For a quick example, let’s take a big nuclear baseload plant with a nameplate capacity of 1,000 MW, run at an average of 90% of nameplate (900 MW) for 320 of the 365 days of the year (320/365, or 87.67%). Based on these numbers, the plant has a theoretical output of 1000 MW x 365 days x 24 hours/day, or 8,760,000 MWh, and an actual output of 900 MW x 320 days x 24 hours/day, or 6,912,000 MWh. Dividing the second number by the first gives a capacity factor of 78.90%[8] for the year[9].
We can see from this calculation that the capacity factor is the most complete of our metrics of capacity so far – also including a measure of the plant’s reliability, at the cost of needing actual generation as an input, rather than being usable as a prospective metric. Using the capacity factors of other markets can give a good idea of how a plant might perform in your market. Let’s do that right now, using some data from the US Energy Information Administration (EIA). We’ll be starting from this article from the Office of Nuclear Energy[10], which also explains capacity factor, before drilling down into the EIA table it cites as a source[11], to take a deeper dive into how useful capacity factor is for energy.
The article cites nuclear power plants as having a 92.7% capacity factor – leaving geothermal (71%), natural gas (54.4%), coal (49.3%), hydro (37.1%), wind (34.6%), and solar (24.6%) in the dust, being 8% of the country’s installed capacity while providing 19% of the electricity. Pound for pound, nuclear is king and we should have more of it – let’s see how that holds up.
Starting from the table linked earlier, nuclear is clearly the best of the table of non-fossil fuel sources. Sporting an even higher 93.1% capacity factor for 2023, going between 80% and 99% on a monthly basis with its 95,099.0 MW capacity, nuclear is an absolute champion with 88,537.196 MW effective capacity (Capacity Factor x Time Adjusted Capacity[12]). Hydroelectricity, whose dams also have to do double duty as water reservoirs, has a low 34.2% capacity factor on its comparable 80,086.9 MW capacity (27,381.72 effective). Solar, both photovoltaic and thermal, have a similar issue – their combined 78,647.2 MW capacity held back by a roughly 23% capacity factor, giving us only 18,088.86 effective MW. Wind is the same problem with slightly better economics at 144,018.9 MW with a 33.5% capacity factor, giving us 48,246.33 effective MW. From a pure capacity standpoint, nuclear is the clear winner – at least before we look at the fossil fuel table.
It is a sobering sight[13]. Coal, despite a low capacity factor at 42.1%, has double nuclear’s installed capacity at 183,856.3 MW (77,403.50 effective, equal to nuclear), while natural gas (combined cycle only) has more than triple with 292,741 MW, operating at a 58.8% capacity factor (172,131.71 MW effective, double nuclear). Many of these plants are likely older and no longer used due to their inefficiency – being brought online as mid-merit or peaking plants as needed by the grid, rather than being consistently run as base-load generation like nuclear plants are. This will drag down the capacity factor of these sources when taken together – some plants will sport high capacity factors, while others will have very low ones. These legacy installations, however, are cheaper to bring back online than new nuclear capacity, with capital costs projected to run into the tens of billions[14]. Beyond this, there are other considerations – one of which is how quickly a generator can adapt to changes in the grid. One of the key measures of this ability is ramp time.
Ramp Times/Rates
Ramp times and ramp rates are two related quantities that talk about how quickly a power plant can go from cold start (completely off) to full capacity (running at full blast). Ramp times describe the time taken to get from 0% to 100% output[15], while ramp rates describe how quickly the generator can change the output[16]. There are different kind of ramp rates and times based on the conditions, neatly summarized in the chart below.
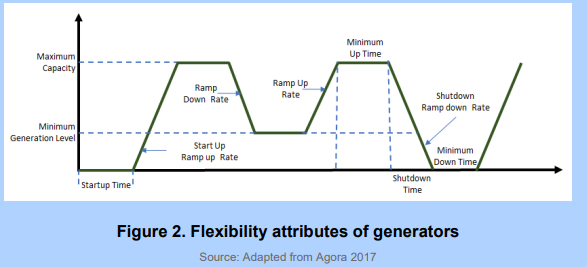
This chart is roughly representative of how power plants operate in terms of increasing and decreasing power output. Note that in order to keep a power plant at the ready, there is a minimum output, like the idle of on your car, from which the plant can ramp up and down. Otherwise, you need to wait for the minimum down time before starting it up again. Startup ramp rate also varies heavily by source, as we see in this chart below from the EIA[17].

We can see here the niche that conventional hydro and natural gas can fill that nuclear and coal cannot. Hydro and natural gas combustion (open-cycle) can immediately react within 10 minutes, while combined-cycle systems (the most capacity in the US) can ramp up within an hour. Nuclear and coal, using massive steam engines, need 12 hours or more to get going – far too slow to be used as a backstop for the grid, which can swing very quickly. These two EIA charts for demand and generation[18] neatly show the point.

The demand chart has a daily dip after 10 PM until 3 AM the next day, when demand picks up again until 10 AM the next day, where it mostly levels off until 10 PM. Even in this one-week interval and forecast, there is significant variation. Remember that we have to use power as it is provided, so changes in demand must be met with plants ramping down and getting ready to go. Looking behind the scenes, we see that things can get pretty complicated. This chart of generation by source will show you quite neatly what I mean.

This chart shows the dance needed to keep our lives running. We see coal being run on a relatively straight, if downward-sloping line – squigglier than nuclear’s ramrod-straight base-load generation, which just keeps the power coming with very little fluctuation. Solar peaks during mornings before quitting for the night, closely mirrored by the ups and downs of natural gas turbines, making up for solar’s shortfalls. Hydro is on a shorter and shallower cycle than solar, since there’s always the risk of running the reservoir too low or too high if they produce too much/don’t produce at all. Finally, wind has no real pattern, coming up and down as it likes.
This is the dance that goes on behind the meter, far away from our homes and businesses. The people who run the generators and the grid coordinate via bilateral supply contracts or electricity spot markets to bring us just the right amount of electricity (with allowances for unexpected failures) dispatch period after dispatch period, day after day, month after month, year after year – all without the rest of us noticing or even thinking about it. It’s amazing to imagine.
Of course, though, that electricity has to be delivered at lowest cost – however you count cost. That’s what we’ll look at next.
Merit Order
The merit order[19] is the order of electrical generators available, from cheapest to most expensive, along with the amount of electricity generated. Dispatching power according to the merit order leads to economic dispatch – the absolute lowest price for the power required. Some markets consider pollution or carbon emissions as an added cost to the merit order (represented as an addition to the price), and dispatching according to that order leads to environmental dispatch – the lowest environmental effect for the power required[20]. Following the merit order is an acceptance that the price offered by the market – the marginal price of electricity – is its cost. Simple and easy, right?
Nothing is simple and easy in energy.
Generating facilities with low marginal costs tend to be those with low fuel costs – geothermal, solar, and wind energy – all of which can afford to bid low electricity prices thanks to low-to-no fuel costs. Feed-in tariffs[21] guarantees a set price for renewable energy sources that qualify, being guaranteed profit as long as they provide electricity. Our sample bill has one – right here.

This particular feed-in tariff, detailed here[22], subsidizes solar energy by PhP 8.68 per kilowatt hour, with consumers being charged PhP 0.04 per kilowatt hour. This comes along with a raft of other privileges, most importantly something called “must dispatch” or “priority dispatch”[23]. This priority dispatch is a privilege granted to intermittent renewable power in the Philippines (wind, solar, run-of-river, and ocean energy), where the market operator must dispatch these sources before any other, rather than following the usual market rules on merit-order pricing[24]. This and other privileges given to less reliable (lower capacity factor) electricity, the costs of which are passed on to consumers, must be balanced against the value of weaning the country off of expensive hydrocarbon imports and the development of a local industry. That’s a debate that’s outside the scope of this guide, but needless to say, these are thorny issues. Let’s keep going down this path.
Because of merit-order pricing, intermittent without fuel costs (like wind and solar) can charge rock-bottom prices when they’re running. However, what they can’t do is respond to demand if the sun isn’t shining and the wind isn’t blowing. The grid naturally wants to keep running, so they’ll keep a fast-ramping, high reliability source on tap – something like hydro or natural gas. These both have to charge high prices to be on standby to support intermittent renewables; the former to not waste the water in the reservoir, which may be needed for other purposes, the latter because the plant must be kept running but disconnected or running slower and less efficient (like an idling car going nowhere fast). This opens them to charges of profiteering, which they are – but they’re also the only reason you still have power. I can show this pretty clearly with one chart from the Philippine Electric Market Corporation (PEMC), which administers the Wholesale Electricity Spot Market (WESM)[25].

Capacity mix refers to how much of each type of generator is on the grid, based on nameplate capacity. Generation mix refers to the shares, by type of generator, that actually reaches the grid. Their relationship is similar to nameplate capacity (theoretical) and effective capacity (practical). Note the jumps in the shares of coal, geothermal, and natural gas when going from capacity mix to generation mix (relatively higher capacity factors) – and compare that to the shrinkage in solar, wind, and hydroelectric (relatively lower capacity factors). Because of the must-dispatch order, however, we end up forced to pay more for less reliable sources of power – albeit ones we do not necessarily have to import.
This is not the only unintuitive result resulting from the rules of the market. The Philippines’ WESM follows merit-order pricing[26] – but with priority/must dispatch status for intermittent renewable sources like wind and solar. The price paid to all participants (the market-clearing price) is based on the last block of power to meet demand[27], in order to encourage power providers to bid low and be first in line after wind and solar. This is the situation.
In this situation, coal and geothermal plants (the Philippines lacks nuclear generation), which run off steam turbines and therefore want to run base-load, must bid as low as possible – so far down, in fact, that they bid negative prices most of the time, averaging well below “giving the power away”. According to the PEMC’s 2022 report, on average they bid below PhP 0 per megawatt hour in order to run[28] – both because that’s not the price they’ll actually be getting thanks to others clearing the market, and because their plants need to run hot to be efficient and take a long time to start up, as we covered earlier when talking about ramp time/rate. While this looks like a losing deal, this is in reality just locking in their spot to make sure they can generate power.
Nothing is simple in energy.
In Summary
The grid needs reliable, clean, flexible, and cheap energy, and no one source is all of these things.
Base-load sources like coal and nuclear are reliable and cheap, but not flexible and not very clean.
Mid-merit sources like combined-cycle gas and hydro are reliable and flexible, but not very clean and less cheap.
Peaking sources are on standby if the worst happens, being none of those four things.
Only a healthy mix of the above three will allow for stable and cheap electricity.
Intermittent renewables like wind and solar are not reliable or flexible, but they’re clean and cheap if you have them when you need them.
Balancing these with your other priorities is neither simple nor easy.
Special Thanks to:
Kathleen McCook of the Ebla to Ebooks Substack.
[1] https://en.wikipedia.org/wiki/Nameplate_capacity
[2] https://www.iea.org/news/massive-expansion-of-renewable-power-opens-door-to-achieving-global-tripling-goal-set-at-cop28
[3] https://www.powermag.com/new-1-2-gw-natural-gas-fired-plant-announced-for-texas/
[4] https://www.reccessary.com/en/news/ph-announcement/world-largest-solar-power-plant-philippines-expected-finish-2026
[5] https://www.eia.gov/tools/glossary/index.php?id=D
[6] https://en.wikipedia.org/wiki/Availability_factor
[7] https://en.wikipedia.org/wiki/Capacity_factor
[8] Sharp mathematicians would have multiplied the average 90% of nameplate and the 87.67% of the year to get the same answer faster. When using actual measured generation, though, this option isn’t exact.
[9] Depending on where you are, this can be too high, too low, or just right for a nuclear power plant.
[10] https://www.energy.gov/ne/articles/what-generation-capacity
[11] https://www.eia.gov/electricity/monthly/epm_table_grapher.php?t=epmt_6_07_b
[12] Fellow nerds can see the definition of Time-Adjusted Capacity at the technical notes linked here. To oversimplify, time-adjusted capacity is based on the plant’s actual observed capacity, rather than directly on nameplate. https://www.eia.gov/electricity/monthly/pdf/technotes.pdf
[13] https://www.eia.gov/electricity/monthly/epm_table_grapher.php?t=table_6_07_a
[14] https://www.synapse-energy.com/sites/default/files/SynapsePaper.2008-07.0.Nuclear-Plant-Construction-Costs.A0022_0.pdf
[15] https://www.eia.gov/todayinenergy/detail.php?id=45956
[16] https://www.nrel.gov/docs/fy20osti/77639.pdf (pg. 11)
[17] For much smaller, combustion-based ship’s engines, it takes about an hour to start them up, neatly summarized here:
[18] https://www.eia.gov/electricity/gridmonitor/dashboard/electric_overview/US48/US48. Retrieved April 2, 2024 – charts are updated live, so it’ll look different at the link.
[19] https://en.wikipedia.org/wiki/Merit_order
[20] If you’ve heard of the “cost of carbon”, it is very applicable here. That cost can be used to add onto the bids of a polluting plant based on their expected emissions, pushing them down, but not out, of the merit order.
[21] https://www.eia.gov/todayinenergy/detail.php?id=11471
[22] https://powerphilippines.com/feed-in-tariff-scheme-in-the-philippines-an-overview/
[23] https://www.pv-magazine.com/2022/10/10/philippines-introduces-priority-dispatch-for-renewables-opens-market-to-100-foreign-investments/
[24] Having very limited native hydrocarbon resources, the argument advanced for this policy is to reduce dependence on conventional hydrocarbon resources, which must be imported. This policy was codified into law by the Renewable Energy Act of 2008, RA 9513, detailed in Section 17 part F of the Implementing Rules and Regulations (pg 19 pdf). https://www.doe.gov.ph/sites/default/files/pdf/issuances/dc2009-05-0008.pdf
[25] Chart taken from page 21 of their 2022 Market Assessment report. https://www.wesm.ph/downloads/download/TWFya2V0IFJlcG9ydHM=/MjY1OQ==
[26] See the following link for the official document. https://www.wesm.ph/downloads/download/TWFya2V0IFJlcG9ydHM=/MjkxNA== starting at page 10.
[27] This briefer shows it better than I can describe. See Page 5, heading Merit Ordering Process. https://www.iemop.ph/home-media/publications/?md_file=d3AtY29udGVudC91cGxvYWRzLzIwMjEvMDYvV0VTTS1CcmllZmVyLWZvci1NYXJrZXQtUGFydGljaXBhbnRzLVVwZGF0ZS1NYXktMjAyMS1fMTYyNDMyMTQyNi5wZGY=
[28] It’s on page 29 of their 2022 Market Assessment report. https://www.wesm.ph/downloads/download/TWFya2V0IFJlcG9ydHM=/MjY1OQ==